Tidb探究 离线安装
TiDB介绍
什么是TiDB
TiDB 是 PingCAP 公司自主设计、研发的开源分布式关系型数据库,是一款同时支持在线事务处理与在线分析处理 (Hybrid Transactional and Analytical Processing, HTAP)的融合型分布式数据库产品,具备水平扩容或者缩容、金融级高可用、实时 HTAP、云原生的分布式数据库、兼容 MySQL 5.7 协议和 MySQL 生态等重要特性。目标是为用户提供一站式 OLTP (Online Transactional Processing)、OLAP (Online Analytical Processing)、HTAP 解决方案。TiDB 适合高可用、强一致要求较高、数据规模较大等各种应用场景。
TiDB五大核心特性
- 一键水平扩容或者缩容
得益于 TiDB 存储计算分离的架构的设计,可按需对计算、存储分别进行在线扩容或者缩容,扩容或者缩容过程中对应用运维人员透明。 - 金融级高可用
数据采用多副本存储,数据副本通过 Multi-Raft 协议同步事务日志,多数派写入成功事务才能提交,确保数据强一致性且少数副本发生故障时不影响数据的可用性。可按需配置副本地理位置、副本数量等策略满足不同容灾级别的要求。 - 实时 HTAP
提供行存储引擎 TiKV、列存储引擎 TiFlash 两款存储引擎,TiFlash 通过 Multi-Raft Learner 协议实时从 TiKV 复制数据,确保行存储引擎 TiKV 和列存储引擎 TiFlash 之间的数据强一致。TiKV、TiFlash 可按需部署在不同的机器,解决 HTAP 资源隔离的问题。 - 云原生的分布式数据库
专为云而设计的分布式数据库,通过 TiDB Operator 可在公有云、私有云、混合云中实现部署工具化、自动化。 - 兼容 MySQL 5.7 协议和 MySQL 生态
兼容 MySQL 5.7 协议、MySQL 常用的功能、MySQL 生态,应用无需或者修改少量代码即可从 MySQL 迁移到 TiDB。提供丰富的数据迁移工具帮助应用便捷完成数据迁移。
TiDB离线安装部署
一、前期准备
wmware虚拟环境
使用vmware部署3个节点服务器,分别是master,node1,node2;使用CentOS7镜像,
创建普通用户--每个节点
groupadd tidb
useradd tidb -g tidb
passwd tidb
输入密码
sudo免密
在每个节点执行如下命令来配置 sudo 免密
vi /etc/sudoers
最后一行输入:
tidb ALL=(ALL) NOPASSWD: ALL
注意最后需要空一行
验证sudo免密
登录中控机master,切换到tidb用户
ssh 到其他目标节点
以192.168.174.129节点为例,其他节点也需要验证
su - tidb
ssh 192.168.174.129
输入密码
sudo -su root
不需要密码切换到`root`用户,表示`sudo`免密成功
eixt   //退出ssh
关闭防火墙
每个节点都需要关闭系统的防火墙
# root账号下执行以下命令
# 防火墙状态
systemctl status firewalld
# 临时关闭防火墙
systemctl stop firewalld
# 永久关闭防火墙
systemctl disable firewalld
| ip | 备注 | 功能 |
|---|---|---|
| 192.168.174.128 | 中控机master | 无 |
| 192.168.174.129 | node1 | PD,DB,KV,TIFLASH,MONITOR,GRAFANA,ALERTMANAGER |
| 192.168.174.130 | node2 | PD,DB,KV,TIFLASH |
| 192.168.174.131 | node3 | PD,DB,KV,TIFLASH |
tidb离线包下载
使用社区版离线进行部署,软件包可以在官网下载。将下载的tidb-community-server-v6.1.0-linux-amd64.tar.gz放在中控机master的tidb账号下的/home/tidb文件目录
二、安装部署
解压执行
下面命令在中控机master执行
su - tidb
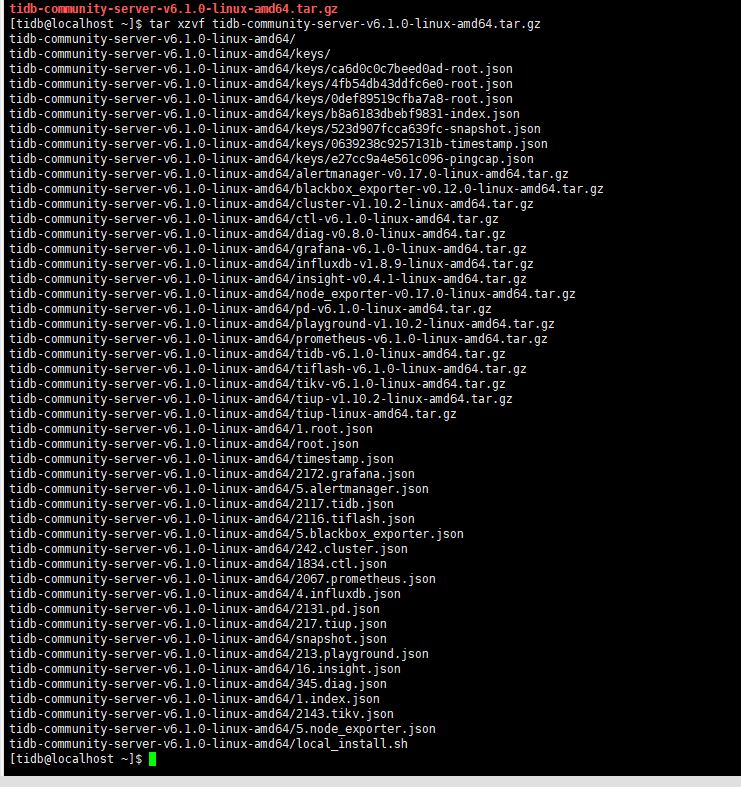
tar xzvf tidb-community-server-v6.1.0-linux-amd64.tar.gz
sh tidb-community-server-v6.1.0-linux-amd64/local_install.sh
source /home/tidb/.bash_profile
配置初始化参数文件topology.yaml
#执行命令
vi topology.yaml
topology.yaml的内容如下:
global:
  user: "tidb"
  ssh_port: 22
  deploy_dir: "/tidb-deploy"
  data_dir: "/tidb-data"

monitored:
 node_exporter_port: 9100
 blackbox_exporter_port: 9115

server_configs:
 tidb:
   log.slow-threshold: 300
 tikv:
   readpool.storage.use-unified-pool: false
   readpool.coprocessor.use-unified-pool: true
 pd:
   replication.enable-placement-rules: true
   replication.location-labels: ["host"]
 tiflash:
   logger.level: "info"

pd_servers:
  - host: 192.168.174.129
  - host: 192.168.174.130
  - host: 192.168.174.131
tidb_servers:
  - host: 192.168.174.129
  - host: 192.168.174.130
  - host: 192.168.174.131
tikv_servers:
  - host: 192.168.174.129
    config:
      server.labels: { host: "192.168.174.129" }
  - host: 192.168.174.130
    config:
      server.labels: { host: "192.168.174.130" }
  - host: 192.168.174.131
    config:
      server.labels: { host: "192.168.174.131" }
tiflash_servers:
  - host: 192.168.174.129
    data_dir: /data1/tiflash/data
  - host: 192.168.174.130
    data_dir: /data1/tiflash/data
  - host: 192.168.174.131
    data_dir: /data1/tiflash/data
monitoring_servers:
  - host: 192.168.174.129
grafana_servers:
  - host: 192.168.174.129
alertmanager_servers:
  - host: 192.168.174.129
安装部署、启动
#  部署
tiup cluster deploy tidb-vmware v6.1.0 topology.yaml --user tidb -p
输入 y 然后 `tidb` 用户密码密码
# 这个过程有点漫长,需要耐心等待

# 初始启动命令
tiup cluster start tidb-vmware  --init

# 查询tidb状态
tiup cluster display tidb-vmware

# 启动命令
tiup cluster start tidb-vmware

# 重启pd
tiup cluster reload tidb-vmware -R pd

# 删除集群
tiup cluster destroy tidb-vmware --force

# 修改配置
tiup cluster edit-config tidb-vmware

# 重启tidb
tiup cluster reload tidb-vmware
部署输出如下:
[tidb@localhost ~]$ tiup cluster deploy tidb-vmware v6.1.0 topology.yaml --user tidb -p
tiup is checking updates for component cluster ...
A new version of cluster is available:
   The latest version:         v1.10.2
   Local installed version:
   Update current component:   tiup update cluster
   Update all components:      tiup update --all

The component `cluster` version  is not installed; downloading from repository.
Starting component `cluster`: /home/tidb/.tiup/components/cluster/v1.10.2/tiup-cluster deploy tidb-vmware v6.1.0 topology.yaml --user tidb -p
Input SSH password:


+ Detect CPU Arch Name
  - Detecting node 192.168.174.129 Arch info ... Done
  - Detecting node 192.168.174.130 Arch info ... Done
  - Detecting node 192.168.174.131 Arch info ... Done


+ Detect CPU OS Name
  - Detecting node 192.168.174.129 OS info ... Done
  - Detecting node 192.168.174.130 OS info ... Done
  - Detecting node 192.168.174.131 OS info ... Done
Please confirm your topology:
Cluster type:    tidb
Cluster name:    tidb-vmware
Cluster version: v6.1.0
Role          Host             Ports                            OS/Arch       Directories
----          ----             -----                            -------       -----------
pd            192.168.174.129  2379/2380                        linux/x86_64  /tidb-deploy/pd-2379,/tidb-data/pd-2379
tikv          192.168.174.130  20160/20180                      linux/x86_64  /tidb-deploy/tikv-20160,/tidb-data/tikv-20160
tikv          192.168.174.131  20160/20180                      linux/x86_64  /tidb-deploy/tikv-20160,/tidb-data/tikv-20160
tidb          192.168.174.130  4000/10080                       linux/x86_64  /tidb-deploy/tidb-4000
tidb          192.168.174.131  4000/10080                       linux/x86_64  /tidb-deploy/tidb-4000
tiflash       192.168.174.129  9000/8123/3930/20170/20292/8234  linux/x86_64  /tidb-deploy/tiflash-9000,/data1/tiflash/data
tiflash       192.168.174.130  9000/8123/3930/20170/20292/8234  linux/x86_64  /tidb-deploy/tiflash-9000,/data1/tiflash/data
tiflash       192.168.174.131  9000/8123/3930/20170/20292/8234  linux/x86_64  /tidb-deploy/tiflash-9000,/data1/tiflash/data
prometheus    192.168.174.129  9090/12020                       linux/x86_64  /tidb-deploy/prometheus-9090,/tidb-data/prometheus-9090
grafana       192.168.174.129  3000                             linux/x86_64  /tidb-deploy/grafana-3000
alertmanager  192.168.174.129  9093/9094                        linux/x86_64  /tidb-deploy/alertmanager-9093,/tidb-data/alertmanager-9093
Attention:
    1. If the topology is not what you expected, check your yaml file.
    2. Please confirm there is no port/directory conflicts in same host.
Do you want to continue? [y/N]: (default=N) y
+ Generate SSH keys ... Done
+ Download TiDB components
  - Download pd:v6.1.0 (linux/amd64) ... Done
  - Download tikv:v6.1.0 (linux/amd64) ... Done
  - Download tidb:v6.1.0 (linux/amd64) ... Done
  - Download tiflash:v6.1.0 (linux/amd64) ... Done
  - Download prometheus:v6.1.0 (linux/amd64) ... Done
  - Download grafana:v6.1.0 (linux/amd64) ... Done
  - Download alertmanager: (linux/amd64) ... Done
  - Download node_exporter: (linux/amd64) ... Done
  - Download blackbox_exporter: (linux/amd64) ... Done
+ Initialize target host environments
  - Prepare 192.168.174.129:22 ... Done
  - Prepare 192.168.174.130:22 ... Done
  - Prepare 192.168.174.131:22 ... Done
+ Deploy TiDB instance
  - Copy pd -> 192.168.174.129 ... Done
  - Copy tikv -> 192.168.174.130 ... Done
  - Copy tikv -> 192.168.174.131 ... Done
  - Copy tidb -> 192.168.174.130 ... Done
  - Copy tidb -> 192.168.174.131 ... Done
  - Copy tiflash -> 192.168.174.129 ... Done
  - Copy tiflash -> 192.168.174.130 ... Done
  - Copy tiflash -> 192.168.174.131 ... Done
  - Copy prometheus -> 192.168.174.129 ... Done
  - Copy grafana -> 192.168.174.129 ... Done
  - Copy alertmanager -> 192.168.174.129 ... Done
  - Deploy node_exporter -> 192.168.174.129 ... Done
  - Deploy node_exporter -> 192.168.174.130 ... Done
  - Deploy node_exporter -> 192.168.174.131 ... Done
  - Deploy blackbox_exporter -> 192.168.174.129 ... Done
  - Deploy blackbox_exporter -> 192.168.174.130 ... Done
  - Deploy blackbox_exporter -> 192.168.174.131 ... Done
+ Copy certificate to remote host
+ Init instance configs
  - Generate config pd -> 192.168.174.129:2379 ... Done
  - Generate config tikv -> 192.168.174.130:20160 ... Done
  - Generate config tikv -> 192.168.174.131:20160 ... Done
  - Generate config tidb -> 192.168.174.130:4000 ... Done
  - Generate config tidb -> 192.168.174.131:4000 ... Done
  - Generate config tiflash -> 192.168.174.129:9000 ... Done
  - Generate config tiflash -> 192.168.174.130:9000 ... Done
  - Generate config tiflash -> 192.168.174.131:9000 ... Done
  - Generate config prometheus -> 192.168.174.129:9090 ... Done
  - Generate config grafana -> 192.168.174.129:3000 ... Done
  - Generate config alertmanager -> 192.168.174.129:9093 ... Done
+ Init monitor configs
  - Generate config node_exporter -> 192.168.174.129 ... Done
  - Generate config node_exporter -> 192.168.174.130 ... Done
  - Generate config node_exporter -> 192.168.174.131 ... Done
  - Generate config blackbox_exporter -> 192.168.174.131 ... Done
  - Generate config blackbox_exporter -> 192.168.174.129 ... Done
  - Generate config blackbox_exporter -> 192.168.174.130 ... Done
Enabling component pd
	Enabling instance 192.168.174.129:2379
	Enable instance 192.168.174.129:2379 success
Enabling component tikv
	Enabling instance 192.168.174.131:20160
	Enabling instance 192.168.174.130:20160
	Enable instance 192.168.174.130:20160 success
	Enable instance 192.168.174.131:20160 success
Enabling component tidb
	Enabling instance 192.168.174.131:4000
	Enabling instance 192.168.174.130:4000
	Enable instance 192.168.174.131:4000 success
	Enable instance 192.168.174.130:4000 success
Enabling component tiflash
	Enabling instance 192.168.174.131:9000
	Enabling instance 192.168.174.129:9000
	Enabling instance 192.168.174.130:9000
	Enable instance 192.168.174.129:9000 success
	Enable instance 192.168.174.131:9000 success
	Enable instance 192.168.174.130:9000 success
Enabling component prometheus
	Enabling instance 192.168.174.129:9090
	Enable instance 192.168.174.129:9090 success
Enabling component grafana
	Enabling instance 192.168.174.129:3000
	Enable instance 192.168.174.129:3000 success
Enabling component alertmanager
	Enabling instance 192.168.174.129:9093
	Enable instance 192.168.174.129:9093 success
Enabling component node_exporter
	Enabling instance 192.168.174.131
	Enabling instance 192.168.174.129
	Enabling instance 192.168.174.130
	Enable 192.168.174.130 success
	Enable 192.168.174.131 success
	Enable 192.168.174.129 success
Enabling component blackbox_exporter
	Enabling instance 192.168.174.131
	Enabling instance 192.168.174.129
	Enabling instance 192.168.174.130
	Enable 192.168.174.129 success
	Enable 192.168.174.131 success
	Enable 192.168.174.130 success
Cluster `tidb-vmware` deployed successfully, you can start it with command: `tiup cluster start tidb-vmware --init`
部署成功后,可以访问如下地址:
| 服务器 | 地址 | 说明 |
|---|---|---|
| pd-dashboard | http://192.168.174.129:2379/dashboard | 账号密码为tidb账户密码。默认账号root,密码在控制台输出;可依据下一篇文章修改密码。 |
| grafana | http://192.168.174.129:3000/ | 账号密码初始均为admin,登录后更改自己的密码。 监控自动关联Prometheus |